
Airliner Style #
The display consists of several components for vario, speed, speed command and altitude. In addition, the MC value, the outside temperature, the battery voltage, the status of the Bluetooth connection and optionally the recommendation for the flaps are displayed. The display is in the form of colored animated bars and has been optimized to accommodate a lot of information in a way that is easy to read. In addition to digital values for the target flight, it also offers a graphic display of the airspeed.
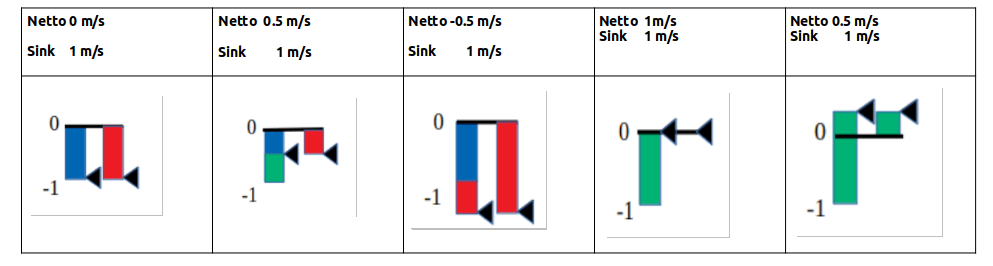
On the left in this style there is the most important display, the variometer display. Climb values are displayed with a green bar upwards, and with a red bar downwards. The white arrow moves with the climb value.
Variometer #
The value averaged over N seconds is displayed digitally to the right (N adjustable).
In the default setting, the polar inherent sink rate is shown as a blue bar downwards in the variometer display as a function of the speed. In completely calm air, a blue bar is shown downwards from 50 km/h dynamic pressure, which corresponds to the polar sink rate at the current speed and load.
If there is additional sink, the red bar below the blue bar expands the display to the current sink value. When climbing, the blue bar is overwritten with a green bar corresponding to the rising of the surrounding air mass from below. The length of the red or green bar corresponds to the net variometer value, at the end of the bar you can read the gross variometer value, the actual rise/fall compared to the ground.
The various variometer displays are shown in the sketches below. On the left with the option for polar sink activated, next to it the classic display on the right without showing the polar sink, i.e. without information about the net climb values. An inherent sink rate of approx. -1 m/s is assumed here in all five cases.
Mean Climb #
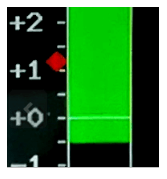
The mean climb is represented as a colored symbol in the form of a small route within the variometer scale and moves up accordingly. Climb values that are too low and that you do not want to include in the core climb can be hidden in the Vario dialog. The medium rise serves to provide the best possible suggestion for the MacCready value.
The icon changes color to green if the average climb has improved by more than 0.2 m/s since the last measurement and to red if the climb has decreased by 0.2 m/s. If this improves significantly, more precisely by more than 20%, the upper part of the route extends into an arrow as shown on the right. In the opposite case, with a clear deterioration lengthens the lower part of the then red symbol shown. The graphic below shows the symbol in the “Retro” display mode (pointer display). If the climb is constant, the icon is displayed in blue color.
Speed Display #
The speed display is in the middle of the display. In this small box, the current speed is displayed in the form of a moving scale, the small white arrow in the middle of the box points to the current speed value. There is also a digital display of the current IAS value above this box.
Speed to Fly #
To the right, the exact value of the speed to fly (S2F Speed2Fly) also digital.
Below the S2F value is the actual speed command in the usual way. It shows down in red color for push or faster, and up in green color for pull or slower. The length of the arrow is measured with the speed to fly difference, from about 45 km/h difference the tip of the arrow is cut off, the arrow gets wider and wider with increasing deviation.
If the deviation is more than 10 km/h, the exact value of the deviation is displayed below or above the command arrow.
Altimeter #
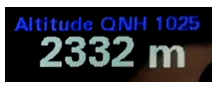
The current altitude and the associated QNH or QFE value (with the standard setting) are displayed below the speed command display. Altitude can be displayed in meters, feet or flight level (FL).
Flaps recommendation #
On the right edge below the small profile is the flap display, which gives a recommendation for the position to be locked in flap aircraft. Five different positions can be shown in the form of a moving scale: -2, -1, 0, +1, +2. The small profile moves the flap (WK) shown in red analogous to the recommendation. The associated optimal speeds according to the polar can be adjusted in the setup depending on the model. The display must be activated in the setup under /Flap (WK) Indicator/Flap Indicator Option/ [Enable]. In addition to displaying the best setting, the WK sensor from the 2021 series can also display the current WK position graphically in the form of a small lever. If the lever position deviates from the optimum flap position by more than one notch, the flap lever flashes red.
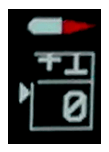
Battery Indicator #
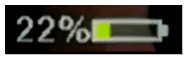
The battery indicator shows the charge status of the battery in the form of a symbol in different colors. The exact value in percent is also displayed. When the battery is running low, the color changes from green to yellow, then red. In addition, the symbol flashes in red. The corresponding voltages are preset for a lead-acid battery and can be modified in the setup.
Temperature #

The temperature at the top of the display, or at the top left in the Retro Style display, shows the value of the outside temperature in °C. If there is no sensor or if the sensor is defective, the value shows “—“. The unit °C or F is also displayed and changes color in the event of temperature deviations in the regulation of the AHRS chip from hardware revision -23. See AHRS Setup for details.
MC-Value #

The MC value shows the current MacCready value. The MC value is the top value in the setup menu and can be easily accessed and modified by selecting it and pressing the button. The value is recorded with the same unit as the variometer is set.
Wireless Symbol #

Depending on the activated standard, the wireless symbol shows either a Bluetooth or a WiFi symbol. An existing connection to the wireless device and the XCSoar application is indicated in blue if data is being exchanged. If there is no longer a connection or no more data is being exchanged (device deactivated in XCSoar), the symbol is displayed in gray.
An additional function is monitoring the connection to FLARM. If PFL* NMEA datasets are received from there, the dot is displayed in green in the case of WiFi and the “tooth” in the case of Bluetooth connection.
CAN Symbol #
Below the wireless symbol there is a symbol for the CAN link, which appears when the CAN interface is activated and indicates a connection with a second variometer or a CAN magnet sensor with green.
Pointer Display #
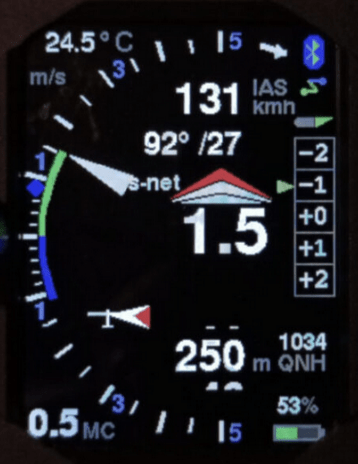
From the software versions November 2020 there is also a pointer display in “retro” style as usual from round instruments. The angle of pointers is perceived better in the corner of the eye than digits or bar displays. This form of display is now also available on In addition, there is a wind display with an airplane symbol and a wind arrow relative to the longitudinal axis of the airplane, as well as a digital display of the wind below the flight speed, which can also show the heading if the compass is equipped.
The pointer mode can be selected “Setup->Hardware Setup->DISPLAY Setup->Display Style” with the setting “Retro”.
In this setting, almost all elements from the previous “Airliner” style can be found again, in favor of an optimal variometer display, the graphic display of the airspeed was omitted here.
In the middle of the display you will find the integrated climb in the unit specified above. To the right of this, as before, can be activated in the setup (as shown here), the recommendation for the optimal flap setting according to the current airspeed. The display is larger and shows the entire range, in the future there will be two more possible positions for up to three positive or negative flap positions.
There are three different display modes, gross, net (net) and relative net or super net (s-net). In gross mode, polar sink rate is represented by the blue line down the scale, and lengthens as sink rate increases. Similarly, for climb, there is a green arc up the scale to the pointer tip, which indicates the aircraft’s actual climb. The blue arc, on the other hand, is independent of the pointer. The length of the blue arc plus the green arc corresponds to the net climb, which is the vertical movement of the air mass around the aircraft. The vario can be displayed linear or logarithmic as shown here.
In the net mode, optimal for cruising, the polar inherent sink is directly included in the pointer position, in addition, in the super-net mode, the polar inherent sink in circling flight is taken into account. So the needle points in advance to the value that you would have as effective (gross) climb if you cranked at the point, regardless of the speed. Switching between gross/net can be coupled with the speed to fly/circling mode (cruise-net). Further details can be found in the description under “Vario Mode” in the setup.
Above and below the mean climb is the display of the speed command. Green bars are shown at the top and red bars are shown at the bottom. Each bar means 10 km/h. On the right side of the display, 4 bars show, for example, 40 km/h flying slower. The MC value at the bottom left is slightly larger than in airliner mode and is therefore easier to read.
Of course, the vario range between 1 m/s and 30 m/s can also be selected as desired, as can the units of vario, airspeed or altitude in addition to the metric system in knots, feet or FL = flight level. The display between circling flight and speed command has changed here, the circling flight is shown above, in fast flight an arrow pointing downwards is shown instead of the circle, which symbolizes the glide path.
The altimeter can be displayed in full resolution or quantized to 10 meters as shown here in the form of a sliding scale.
The temperature display has found its place in the top left corner, bluetooth has not changed and the battery display has remained in its rightmost place at the top and bottom.
The average climb is also visualized, as in the airliner mode, by means of a rhombus within the scale, the rhombus changes color and shape depending on the trend, the average climb improves and the color changes to green, and if the average climb deteriorates, it shows the color red . For details, see the previous chapter for medium climbing.
In addition, there is a wind display with an airplane symbol and a wind arrow relative to the longitudinal axis of the airplane, as well as a digital display of the wind below the flight speed, which can also show the heading if the compass is equipped.


